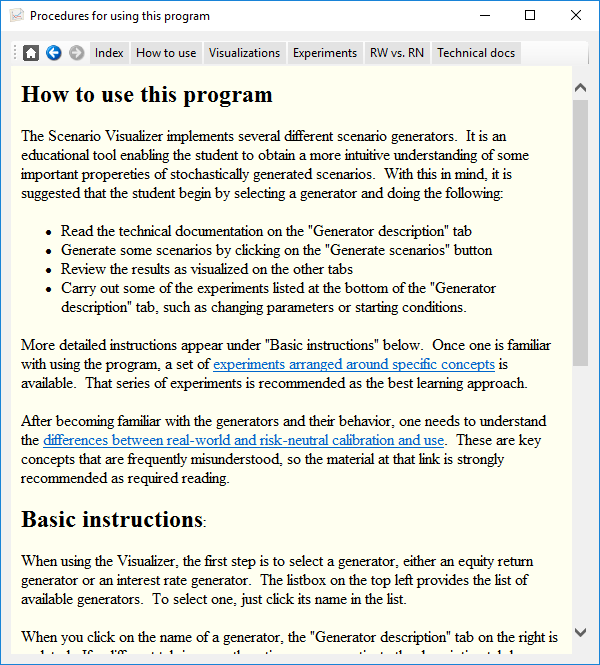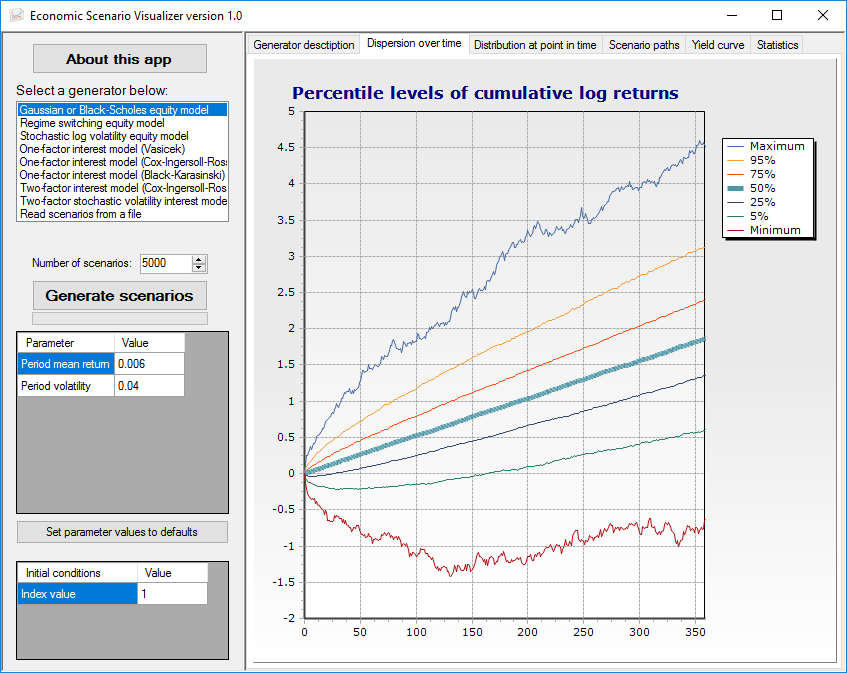
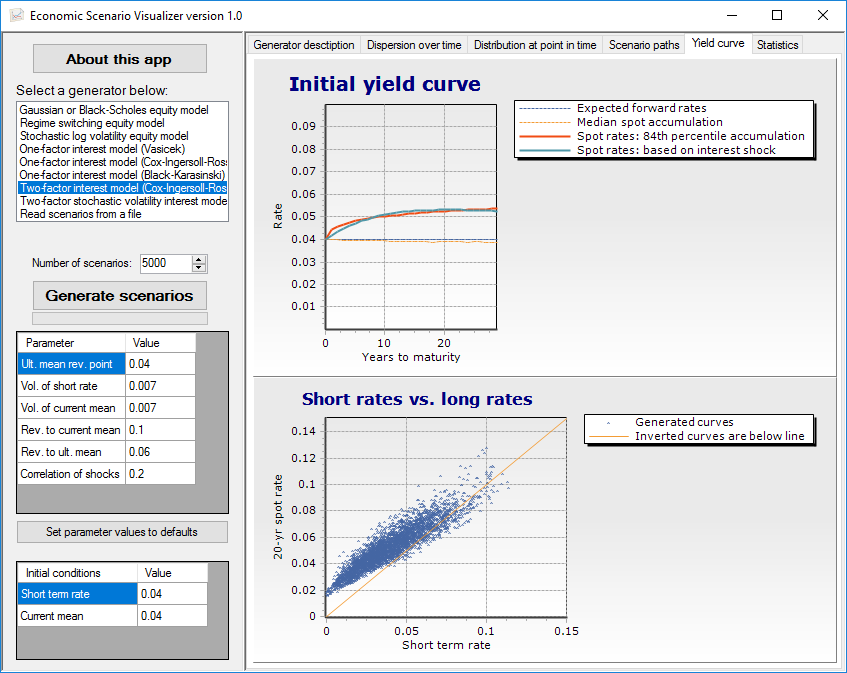
Screen shots of the Scenario Visualizer
One chooses a scenario generator on the top left, sets parameters and initial conditions on the bottom left, and generates sceanrios by clicking the button on the mid-left. Visualizations of the generated collection of scenarios appear in the tabbed area on the right.
The screen shot below shows the dispersion of returns from an equity generator.
The screen shot below shows some views of the yield curve from a two-factor interest rate generator.
Clicking on "About this app" brings up the tabbed help dialog shown below: